
Anyone my age can remember the sweet old ladies, adjusting their glasses, squinting, and asking: “Where’s the beef?” That marketing campaign led to Wendy’s increasing their revenue by 31% in 1984. The catchphrase made its way onto t-shirts and even political campaign slogans.
In the fast moving age we live in, I am hearing people start to ask that question about the economic benefits of AI. After all, if it’s helping people write software code and do their work faster, doesn’t it make sense that it would lead to better sales or margins for the firms adopting it? It’s been over four years since GitHub Copilot, the first AI-driven software writing assistance tool, became generally available and promised to transform software productivity. So, where’s the beef?
As a researcher, I’ve started to fall in love with this question. I’m not the only one, not by a long shot.1 The goal of this essay is to share some of what I’m learning. I want to help you understand the economic frameworks that scientists are using, some history of other technological revolutions, and give you the high-level view of what the facts tell us about where we are on the curve when it comes to AI.
TL;DR
There is no beef yet, at least not in the financial details of the 1k publicly traded companies I looked at. However, by monitoring financial disclosures, we should be able to detect when AI adoption starts to impact them and predict when we’ll start to see the benefits show up more obviously. We’ll do that by looking for dispersion that will show us when early adopters start making bigger bets. Read on for the details.
The danger in hyperbole
I started with a basic idea: publicly traded companies should show some kind of marker in their earnings data that helps us understand the impact that AI is having. Revenue, margin, R&D investments… something should start to look different, right? Listening to analysts talk about how AI is going to radically change the economy would make you expect to see something starting to happen.
Except it doesn’t - at least not in a way I can reliably detect. Across these companies, I did not find evidence of the pattern of changes in the financial measures that we might expect AI adoption to affect. For the most part, the markers are flat. Margin showed improvement, but it came from cost cutting, not as a result of investments that have paid off. That does not mean AI has produced no benefits inside individual firms. It means those benefits are not yet large or widespread enough to distinguish from everything else affecting company performance.
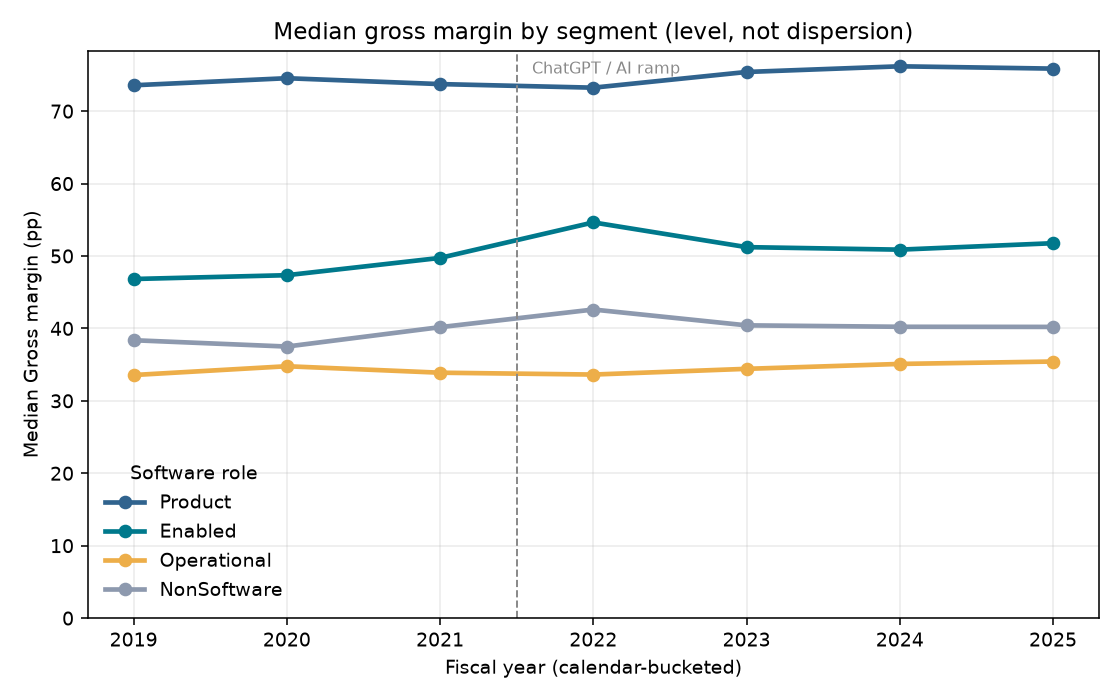
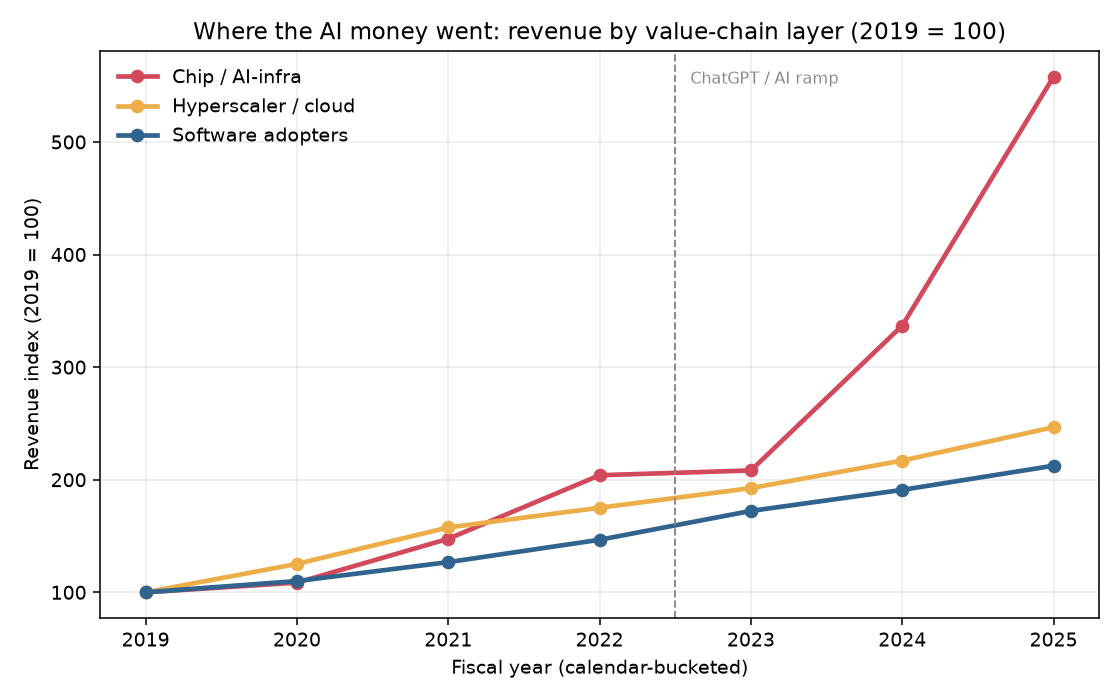
To be sure, there are a few players showing massive revenue increase… but it’s pretty narrow right now:
There are wild claims being made about what AI is going to do to the economy. Mass layoffs, AI systems replacing human thought, etc. However, the scientists who study how the economy works have models that help us make more grounded predictions. At least one of those is only predicting a modest 0.53% increase over the next ten years in total factor productivity thanks to AI.2 So while we already see layoffs, if firms are justifying them as an effect of AI adoption I think these findings increase the risk that the true story is more complex than that. It just seems far too early in the adoption curve to justify the level of layoffs some of these firms are doing.
Where my study data comes from
The SEC helpfully provides the information publicly traded companies have to disclose every quarter. It’s free to access. GitHub Copilot went GA in late June of 2022, so I used that as an anchor point. To avoid bias, I figured out which companies were in the Russell 1000 index as of that date, then pulled those company’s finanical records from 2019 to today.3 All financial analysis I report will be based on this information.
In all I pulled in >30k SEC filings and restatements (amendments) covering 1,008 companies from 2019‑01‑02 to 2026‑08‑21. That broke out into >21k 10-Q, >7k 10-K, and 327 DEF 14A filings. Those got parsed and turned into 1.4 million raw financial facts. All the analysis in this essay, including the two charts above, come from that dataset.
Segmentation: comparing the incomparable
Given that the companies I’m studying are vastly different in size and business model, I focus on ratios, relative changes, and use segmentation to try and compare like-for-like as much as possible. I created four segments based on the role software plays in the business model:
- Product: the company invests in building software that is sold to and directly used by their customers. ServiceNow, Salesforce, Adobe, and Intuit are all good examples.
- Enabled: the company builds software that enhances the core service or product they sell. Customers may consider the software capability of their product, but that’s a secondary concern. Visa, Block, and Tesla are good examples.
- Operational: the company builds software that improves internal operations and product development, but most of the software they build is not exposed to customers. Ford, Walmart, UnitedHealth, and Costco are examples.
- Non-software: this is our reference group. These companies primarily buy the software they use to run their firms rather than build it themselves. Exxon, Chevron, Dow chemicals, and Bunge are all examples.
Note that this essay is not talking about AI oriented products a company may be creating and selling. For example, John Deere has talked about bundling AI capabilities into the tools they build for operators to use to diagnose problems faster. That’s a different dimension - it could drive revenue, but that’s not the focus here. This essay is primarily concerned with the way these firms use AI to change how they build software.
Technology transformations normally look like J-curves
When I started to see the results of my analysis I got confused. I expected to see a drop in margin as companies start to pay for AI services, invest in training, etc. Those would then lead to increases in revenue as these tools increase productivity.
This is what the experts say happens every time there has been a major transformative invention. Unfortunately, they call these things GPTs: General Purpose Technology. That label means papers about AI economics will continually confuse readers who see GPT and think about ChatGPT. But GPTs include things like steam engines, electrification, dynamos, and computers themselves. And it takes a long time for these to really have an impact. It took 40 years for electrification to show an improvement in productivity.4
Brynjolfsson’s paper builds on other economic theories to suggest that companies adopting new technologies will appear to lose productivity at first.5 This is because they are investing in “intangibles” such as new hardware, training, processes, and organizational designs. They are intangible because they are inconsistently quantified in SEC filings. All we would see is a slight drop in margin.
But as companies figure out how to get the most out of GPTs that changes quickly. Electrified factories had to come up with new ways to measure quality because electric machines were far more precise than steam powered machines being driven off a single, central power capability. Better quality frameworks allowed for much better products, which drove much higher sales than before. The same process had to play out for computer based productivity - data had to be digitized, new processes designed, and eventually that allowed companies to do things they couldn’t feasibly do before.
We take for granted how computers are used today. But there was a time when economists were very confused about why computers were not apparently driving a revolution in company financial performance. Computers were “everywhere but in the productivity statistics.”4 It takes a long time to retool, and the retooling is necessary to get the benefit. I think that’s where we are with AI.
Think about how most big companies work. We have the same organizational design, roles and responsibilities, computer hardware, and processes to review software code and get it to production as we did five years ago. Most big companies haven’t even done broad training yet. Unless you believe that the act of writing software code was the primary constraint, introducing AI will not have a material difference on its own. I have a hard time imagining that at a macro level our industry has really figured out how to take full advantage of AI and addressed all the constraints involved to accelerate the entire process. That is the story I see in the financial data.
What we should be looking for
The theories suggest that after a period of investment, early adopters will start to differentiate from their competitors. The charts will start to show this as increasing dispersion. Basically, the distance from the highest and lowest performers will start to increase. That signal tells you that some companies have started to show benefits while others are lagging. Intuitively, I would expect to see Product companies show this effect before other segments. We don’t see this effect yet except in the control group, the last place AI should be having an effect.
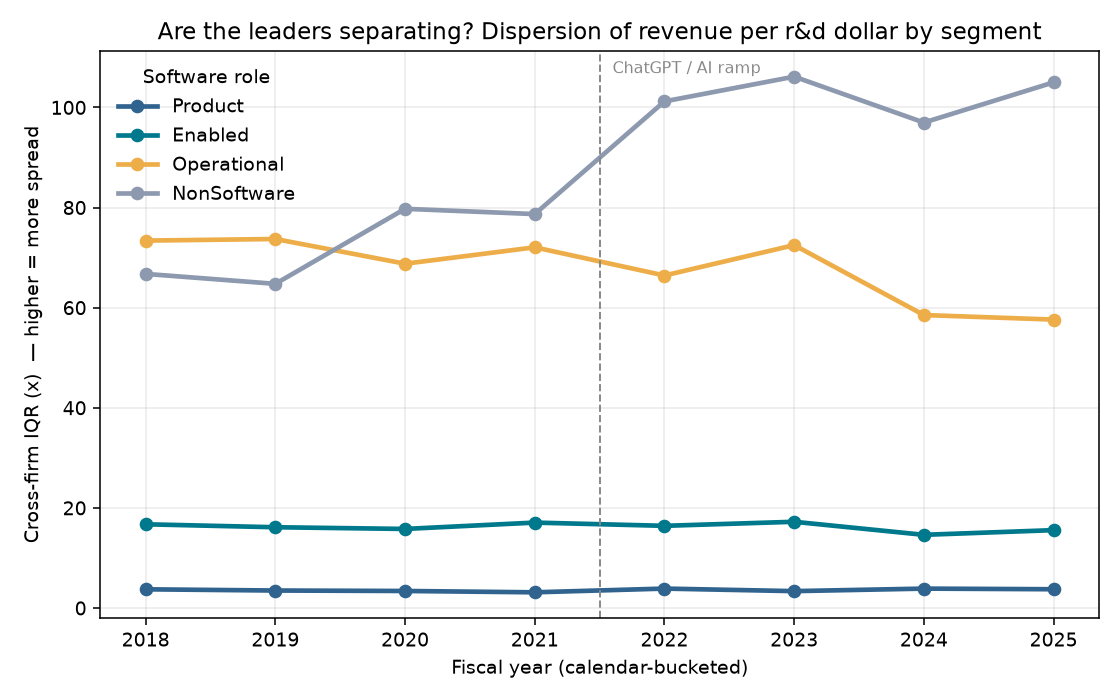
We don’t see dispersion starting to happen in Product and Enabled firms on the margin side, and we’d expect them to show it first:
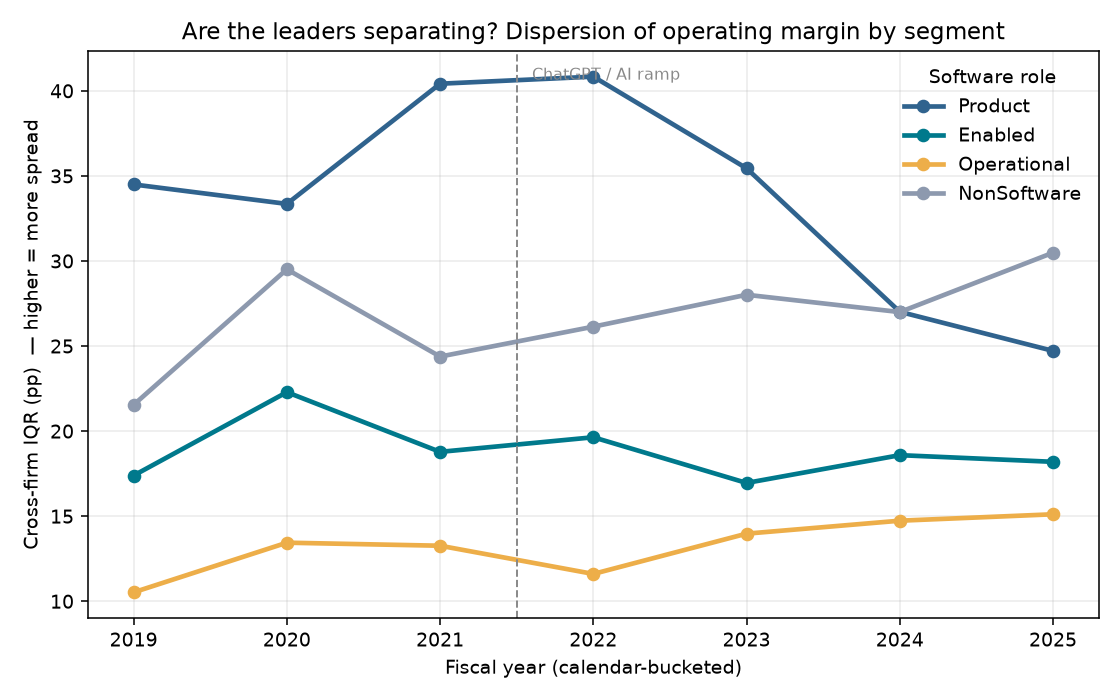
Looking at it differently, this boxplot view shows you that margin dispersion is actually decreasing for the Product segment.
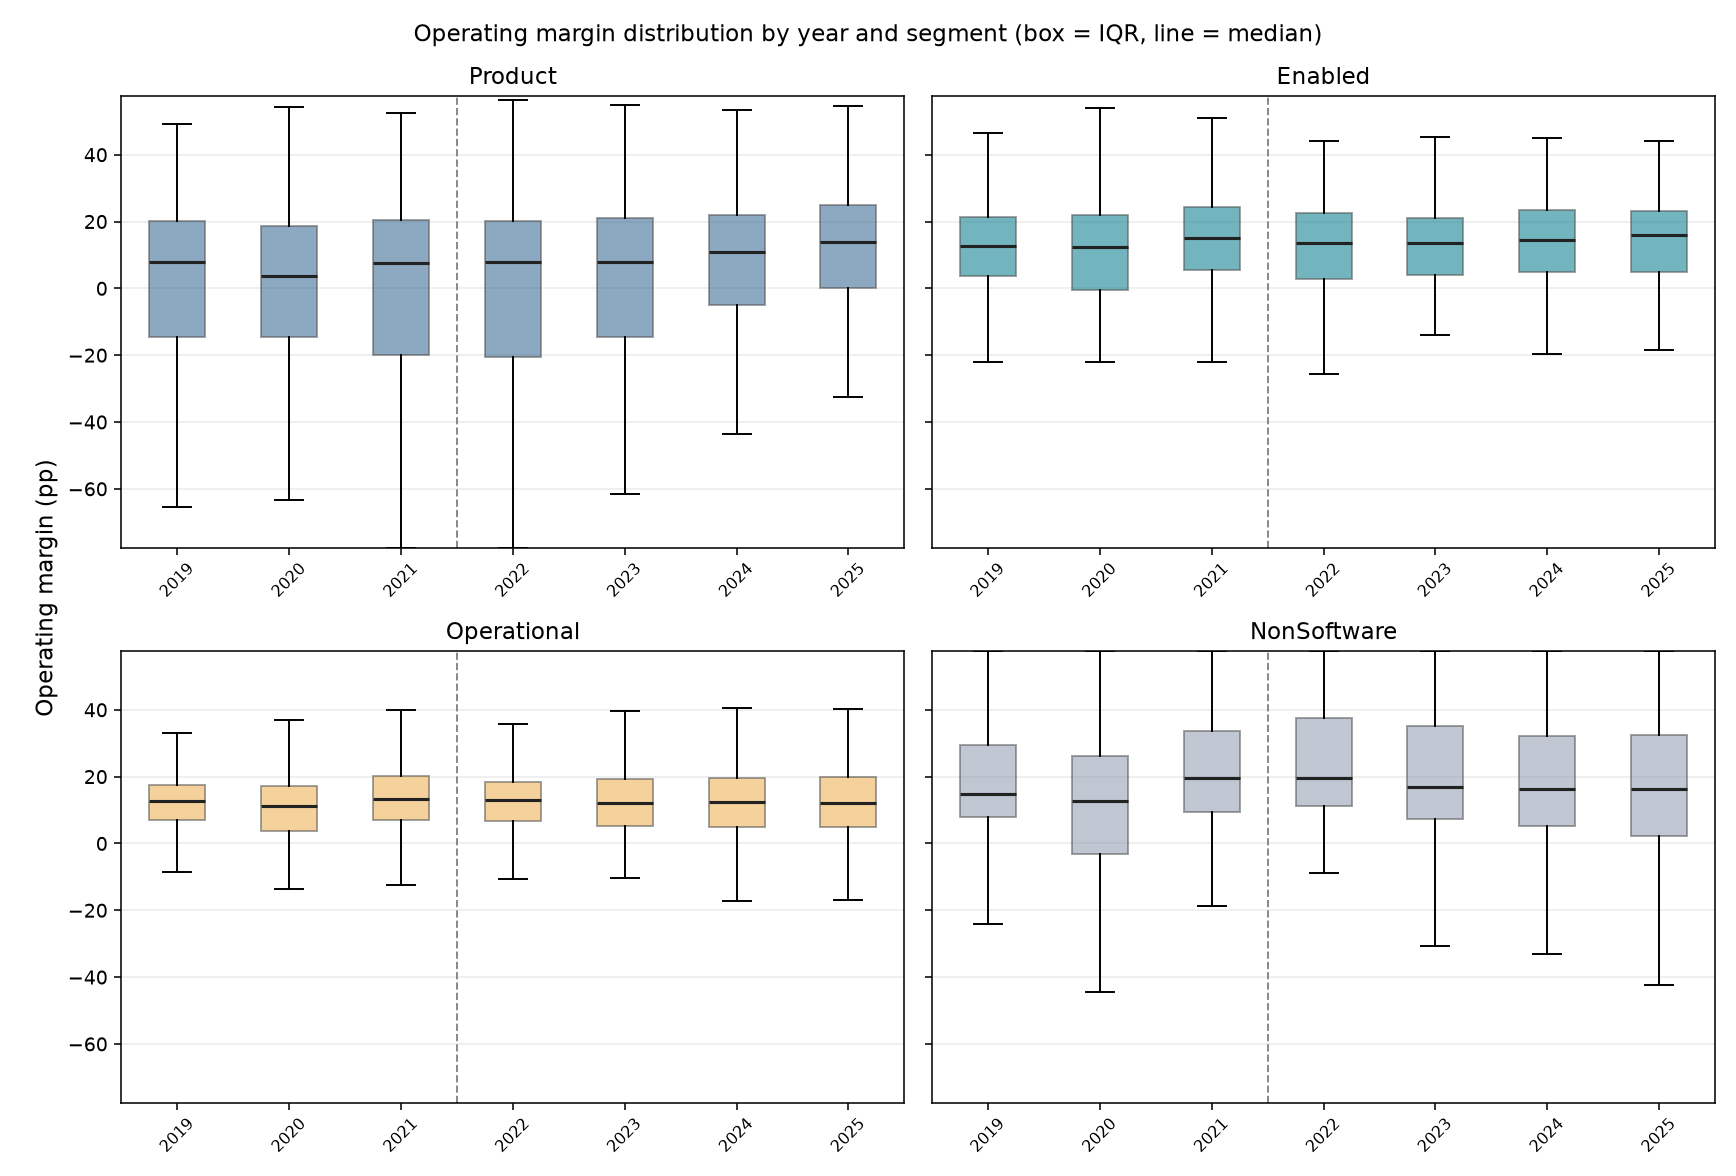
This issue deserves a bit more thought. Dispersion is how we will detect where firms are making larger investments, or seeing larger returns by way of revenue. It shows us when the gap between the highest and lowest values is widening. Large dispersion means lots of variability between the companies. Seeing margin and revenue dispersion decreasing in Product companies means we don’t yet detect a shift toward intangible investment.
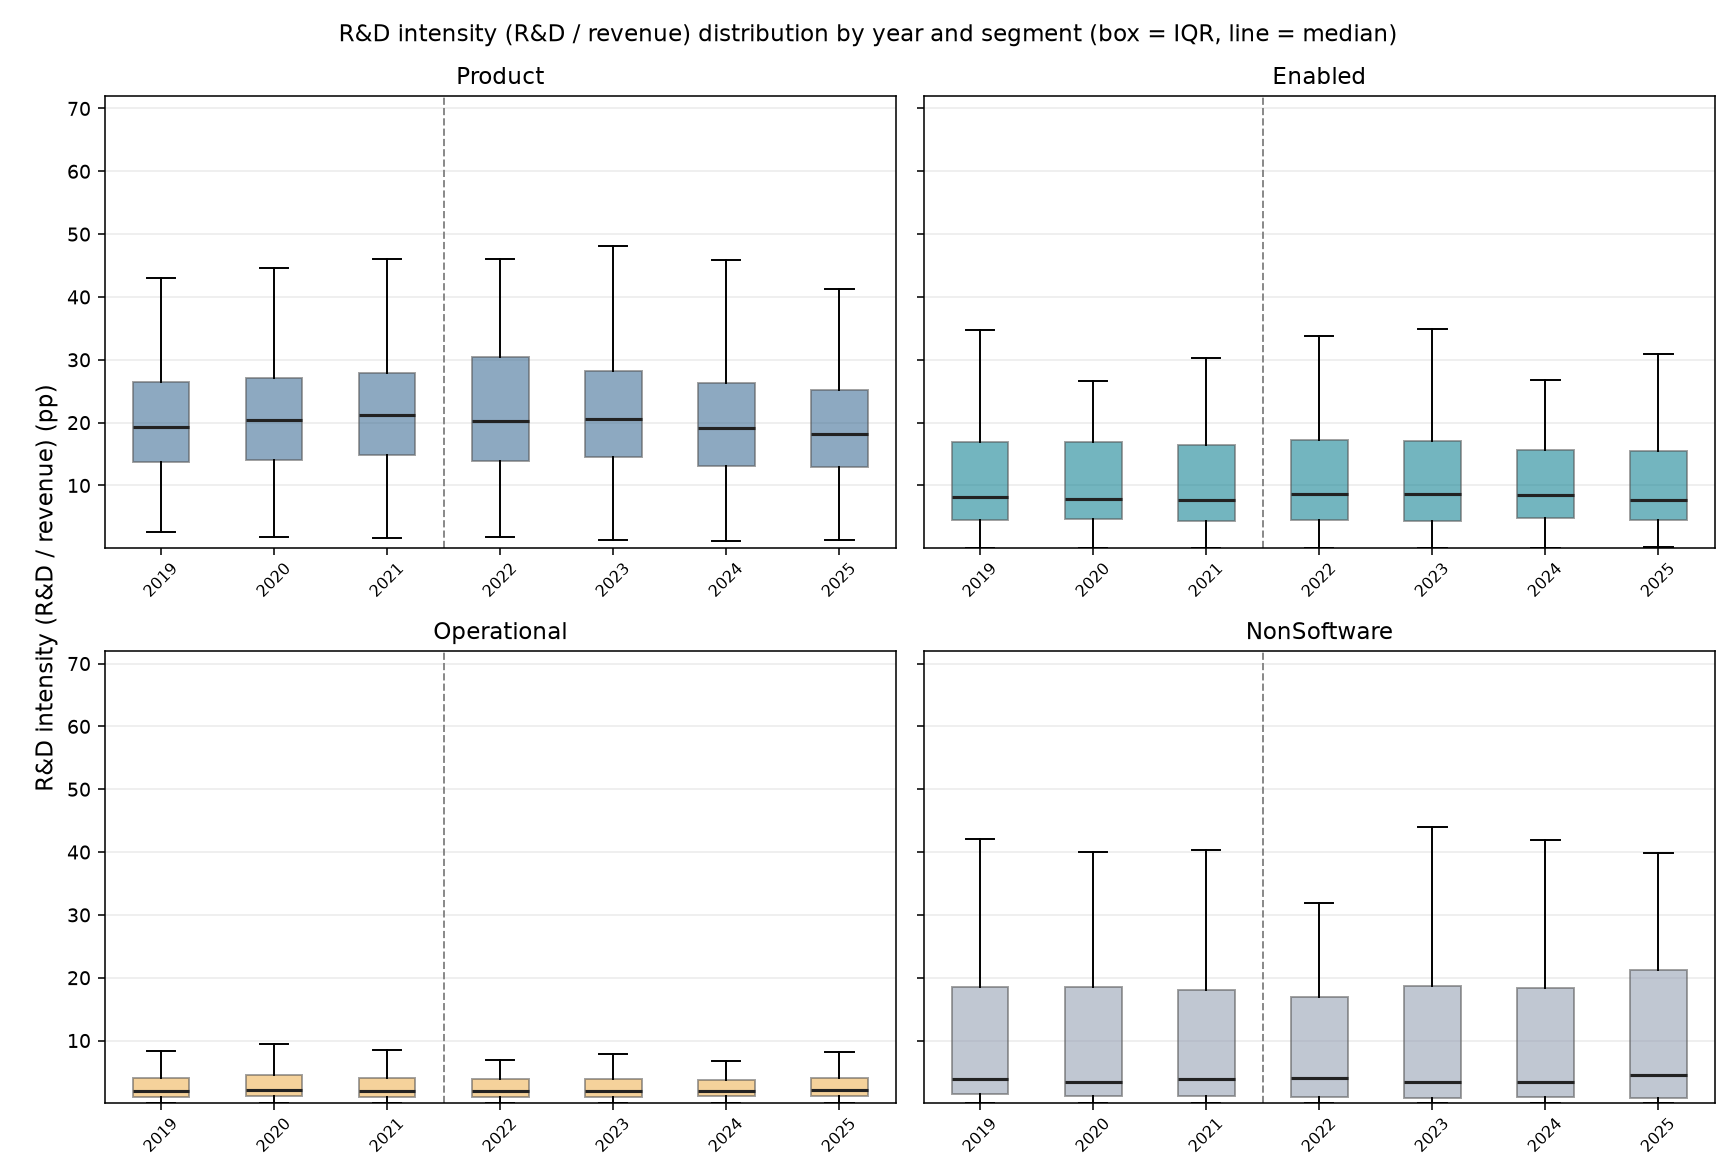
Another predictor is R&D intensity (the amount the company spends on R&D relative to revenue), but it is also not showing the predictive change we’d expect if a notable number of companies were aggressively investing in the intangibles these companies will need to start realizing a big benefit from AI adoption.
Conclusion
I’m shielding you from a lot of boring math, but I want to call out how how I’m tracking this going forward. Before trusting any “nothing’s happening” conclusion, I checked whether this data could even see an AI-sized effect if one were there. Using the real companies as a baseline, I ran a power analysis: I injected pretend effects of known sizes into the data and measured how big one would have to be before a statistical model could reliably catch it. The floor came out around 2-3 percentage points of margin. Credible forecasts of AI’s near-term productivity gain are far below that - fractions of a point a year. So the takeaway is that any effect this early is smaller than company financials can resolve - and, separately, the patterns that would surface first if it weren’t (early adopters pulling ahead, R&D spending climbing) aren’t showing up either. For now the story is a nothingburger.
However, that does not in any way mean this won’t change, and likely soon. AI providers have been subsidizing the cost of their services but there is plenty of indication that those subsidies are shrinking or going away. I’m going to be watching Q2 and Q3 disclosures very closely to see if those changes show up in the financial statements. This analysis helped show how big the swings are going to need to be to be detectable, so I’ve got a foundational approach I can scale up as new data is released.
What will be really interesting is whether the conservative predictions on productivity play out or if firms are somehow able to do a lot more. If companies end up laying off thousands of people to offset increased operating costs due to AI, and only end up matching their prior performance, the economy as a whole loses big time. You need to generate new dollars to create new jobs for the people offset by AI. If the economy ends up flat, there’s no new dollars to invest, and those people won’t have jobs to retrain themselves to do.
My bibliography tool found 146,000 matches for “Macroeconomics of AI” on google scholar… ↩︎
D. Acemoglu, “The simple macroeconomics of AI,” Economic Policy, 2025 ↩︎
Lest anyone think this makes it easy, let me add some detail. While the SEC provides downloads of financial disclosures, it’s still up to you to normalize it and make sense of it. Not every company reports data the same way - they get to use different tags to describe the details that matter more to them based on the type of company they are. Also, the SEC doesn’t make it easy to keep up with the complicated corporate actions that can affect tracking this data over time. Companies get bought and sold, rename their ticker symbols, or just go out of business. Also, while membership in the Russell 1000 changes year over year, to avoid survivorship bias I track the same set of companies forward and backwards from June 2022 so we’re always looking at the same set of companies. ↩︎
P. A. David, “The dynamo and the computer: an historical perspective on the modern productivity paradox,” The American economic review, 1990 ↩︎ ↩︎
E. Brynjolfsson et al., “The productivity J-curve: How intangibles complement general purpose technologies,” American Economic Journal: Macroeconomics, vol. 13, no. 1, pp. 333-372, 2021 ↩︎